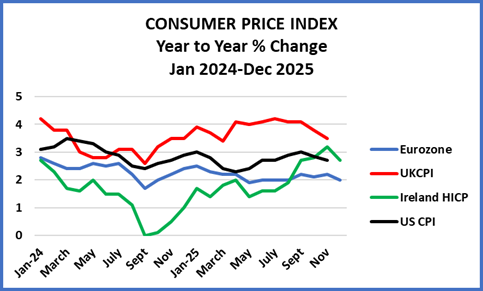
The latest figures on inflation for Ireland released by the CSO is the “flash” figure for the Harmonised Index of Consumer Prices, the EU’s measure of inflation. It shows a year to year increase of 2.7% for Ireland. This is a welcome decline from November’s high of 3.2%. Food inflation continued, but it was offset by a decline in energy prices.
The Irish Consumer Price Index, the measure favoured by the CSO, and more generally quoted, will be released in mid January.
In the US the figure for inflation in November was 2.7%. As this was down a bit on the last monthly figure (which was for September and was 3.0%.) it was greeted with relief. As the latest unemployment figures show an increase, the odds are on further cuts in the Fed interest rate after 0.25% cuts earlier in December and also September and October.
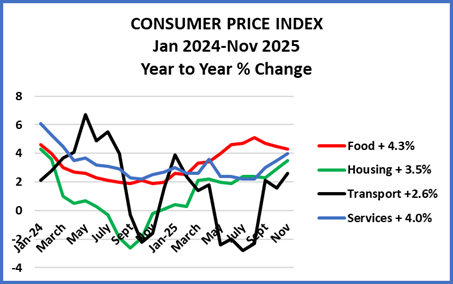
The second graph shows some detail on the Irish CPI for the period to November. For once, Food was not a leader. Instead all the other categories rose faster than the average.
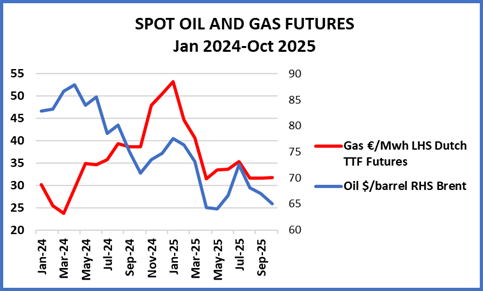
Oil and gas are critically important commodities and major influences on prices. In most of 2024, gas had been increasing in price while oil had been falling. But since the start of 2025 prices of both have been falling. This continued into last December. The US intervention in Venezuela seems likely to accentuate the downward trend – unless it sparks a general rise in international tensions. Generally, oil and gas supplies are relatively aboundant and demand sluggish because of slow growth in Europe and the far east.


Unless noted to the contrary all graphs are based on CSO statistics.