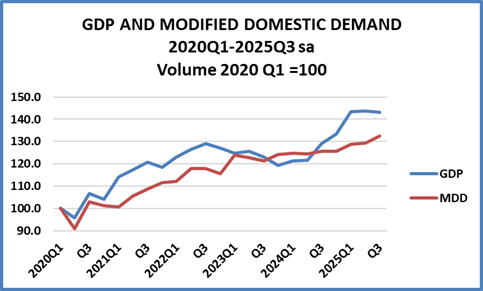
Final estimates of GDP in the third quarter record a slight dip of 0.3% compared with the second quarter. But that still leaves GDP 10% higher than in the third quarter of 2024. Modified Domestic Demand, a measure of domestic economic activity rose by 2.3% which is was one of the rare occasions in which the domestic economy outperformed the foreign sector which tends to dominate the overall GDP figures. MDD is now 5% higher than a year ago. The main take away is that the huge jump in the economy in the first quarter due to US exporters trying to anticipate tariffs has not led to a sharp fall in the succeeding two quarters.
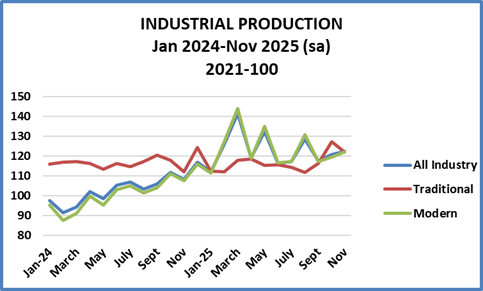
The decline in industrial activity in April, which followed the surge in the first quarter due to the stampede to beat US tariffs, has been followed by an up and down but generally slightly declining pattern slightly offset by a small increase in November. Overall, output so far this year has been well above levels in 2024. Thus, output in the third quarter is 15% up on the third quarter of 2024 and November 12.9% higher than November 2024. As ever the running is made by the modern sector. The traditional sector did increase in September and October nut fell back in November and so far has not been much above 2024 levels.
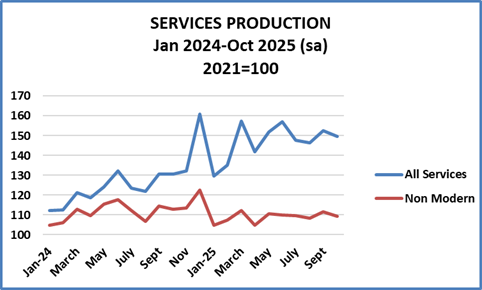
Services – powered by the modern information services sector – followed a similar pattern to industry. After a good year in 2024 services continued to expand briskly and production was running well ahead of 2024 levels in the first quarter of this year. In April, the downturn visible in GDP and industrial production manifested itself in services too but to a less marked extent. Still, in the second quarter production was well below first quarter levels but recovered in the third quarter and still way ahead of year ago levels. In October the index dropped slightly but was still 14.7% higher than in October 2024. The non modern sector has continued to run at a subdued level throughout 2025 to date.
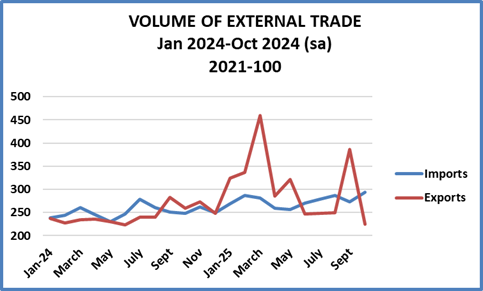
The driving factor behind growth and decline in industrial production (and services) in the ten nine months of 2025 has been exports as seen in the Trade graph opposite. The volume of exports in the first quarter was 46% higher than in the previous quarter and 64% higher than in the first quarter of last year. In April, with the US tariff deadline past, the volume of trade declined dramatically and fell gain June. The September figures show another surge, mainly of pharmaceuticals to the US. It is thought that like in the first quarter this has something to do with expectations about tariffs. Accordingly in October, the index fell back. Overall, the volume of exports are 26.1% higher in the first ten months of the year compared to 2024. Imports are up just 9.8% in the same time.
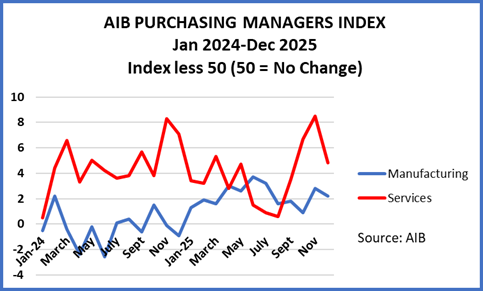
The AIB Purchasing Managers Index showed a sharp decline in the rate of activity in December for Services which remains in positive territory, In Manufacturing the rate also declined but still maintained growth.
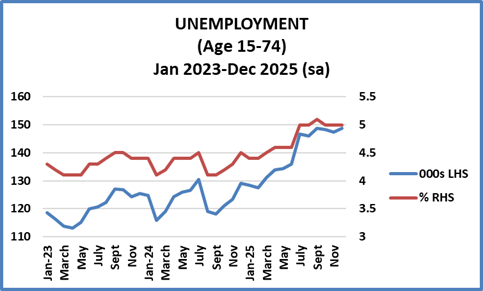
The final graph shows unemployment in absolute and percentage terms for December. The upward trend over the last year has come to a halt levels have been more or less stable for the last few months.
Unless noted to the contrary all graphs are based on CSO statistics.