The CSO recently released estimates of the population of Ireland as of April 2024. As of that date the population was 5.38 million up 1.59 million on 3.78 million in April 2000. That is an increase of 41% or about 1.5% compound over the period and is almost without parallel in Europe outside the disruptions of war. Only Malta and Luxembourg had higher population growth rates while the growth rate for the EU was 5% over the 24 years.
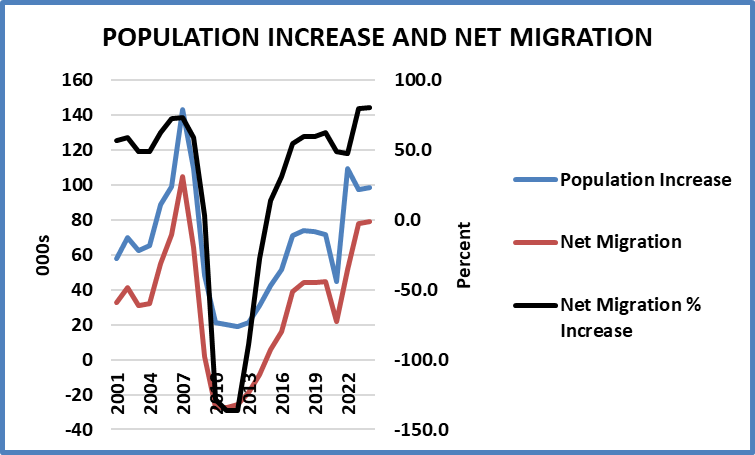
As can be seen from the graph in 2024 the population (black line, LHS) rose by 99,000 – a bit lower than 2022 when it rose 109,000. As can also be seen the driver of population growth is migration (red line, LHS). This was about 30,000-40,000 in the early 2000s but rose rapidly to 105,000 at the peak of the boom in 2007 and plummeted to net emigration of about 28,000 in the nadir of 2010. Since then it has recovered, subject to a glitch during Covid, to the 100,000 mark. Migration as % population growth is shown by the red line and in terms of share of population growth by the black line (RHS). Overall migration accounts for 47% of the population growth since 2020. But the trend is upwards: last year net migration accounted for 80% of the population increase.
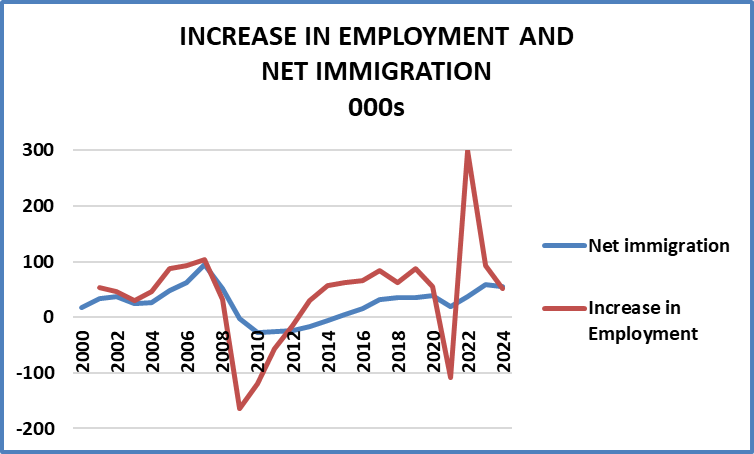
The second graph shows a related matter: the role of migration in growth of employment. Total employment (red line) grew up to the crash and then fell before recovering until Covid. The steep fall in 2021 was recovered in 2022 and moderated in 2023-24. Last year employment grew by 50,000. Net migration (blue line) is net migration of all those aged 25-64, which is pretty conservative since, in the 15-25 age group, though many are at school and college, many are also in the labour force. Migration has proved more volatile than total employment. Even so it was negative in the years post-crash. In 2024 migration, defined as above, exactly matched the increase in employment.
Over the years since 2001 employment has grown by 923,000 and net migration (of over 25s) has grown by just 500,000 or 54% of the total.

